
When I was young, amongst other things, I really loved LEGO. LEGO was a way for me to express creativity by using colourful bricks to build the model of my dreams. Spaceships, buildings, vehicles and, my personal favourite, pirate ships. Today, amongst other things, I love data, it allows me to dive into the real world events and build a picture. Much like LEGO, the real fun with data starts, when you have loads of bricks (different data sets) and put them together to draw the bigger picture.
Today I wanted to show you how we can combine the LEGO world with the data world, and what it allows us to discover.
Building the LEGO analytics
A few months ago on the rebrickable website, I stumbled upon a data set that contains all the information about LEGO sets, which parts go into which set, which set belongs to which theme (Star Wars, Harry Potter, City, etc.), when these sets were produced, which colour the pieces have, and so on.
I put the tables together in a Qlik Sense application, called it “Brick Sense” and investigated the data for a while.
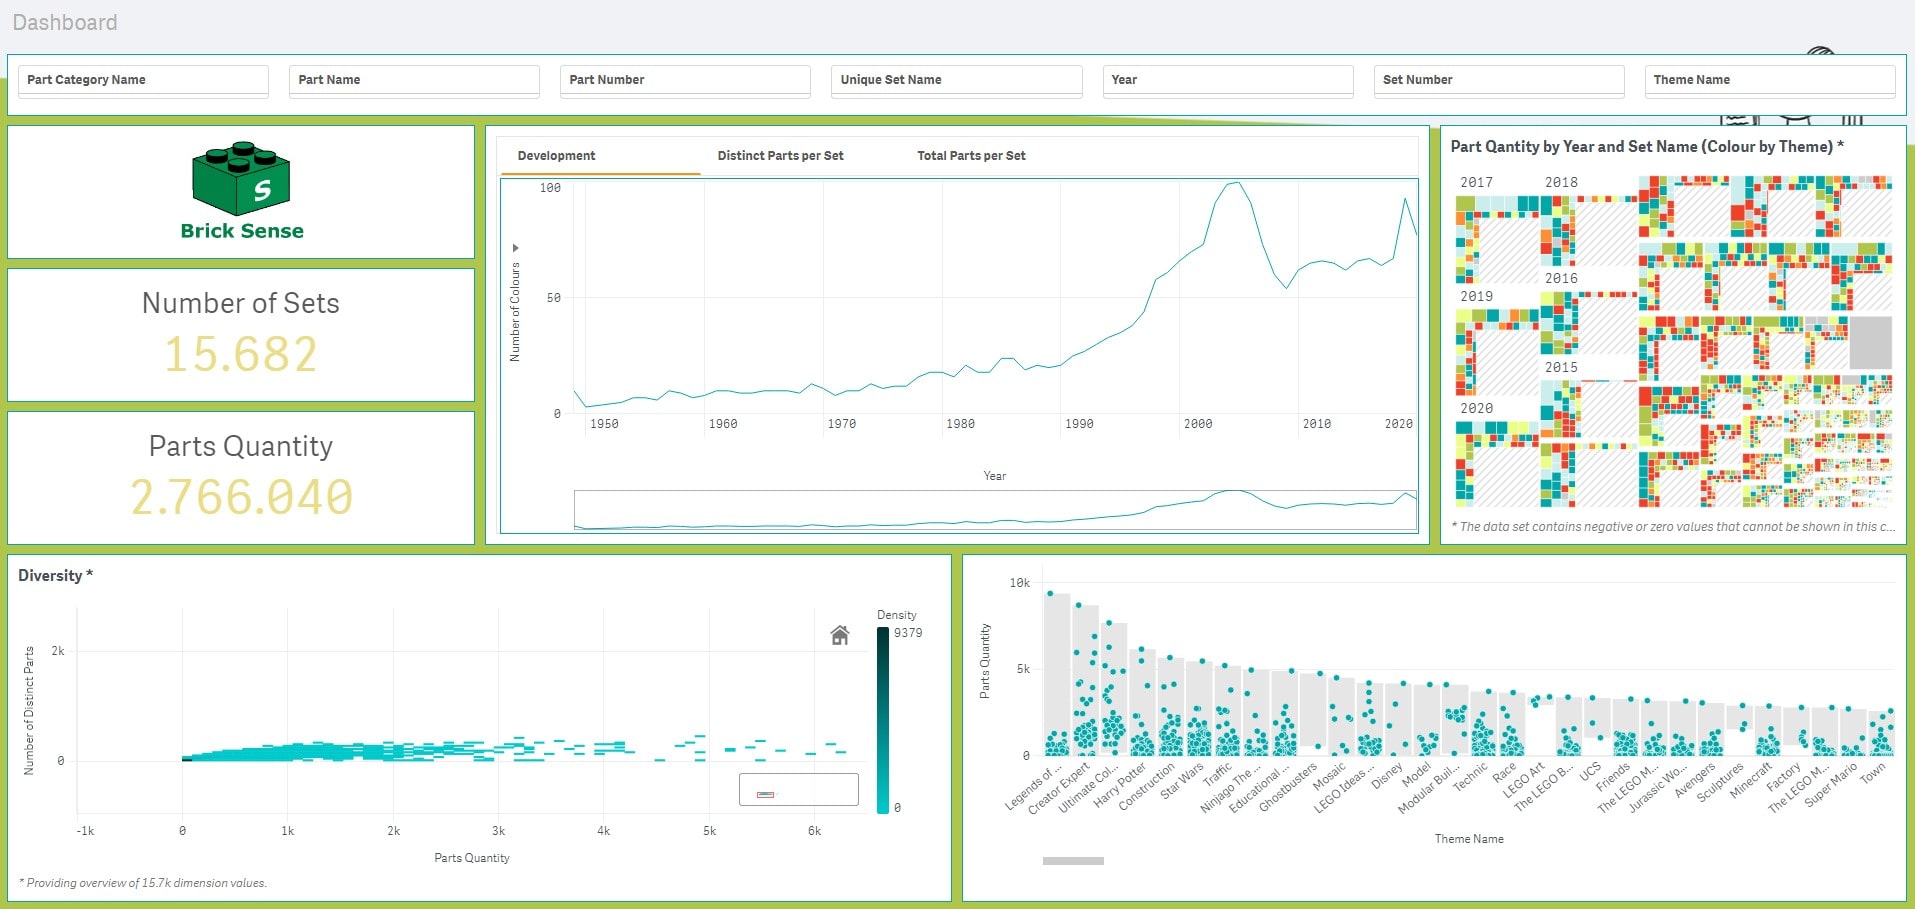
Just looking at the dashboard I already learnt a lot of things. For example, that there have been more than 15,000 LEGO sets available since 1950, the number has constantly increased until hitting the current high of 840 (in 2019 - I have not included 2020 in the picture, since the year is not over yet - FYI there are 662 sets to this day). Considering that LEGO sets stay on the shelves for an average two years before they get retired that means that there are currently more than 2,000 sets available to purchase new (2018, 2019, 2020 - 2.318 sets). When I was young, there were just shy of 400 sets available (1989, 1990, 1991 - 390 sets).
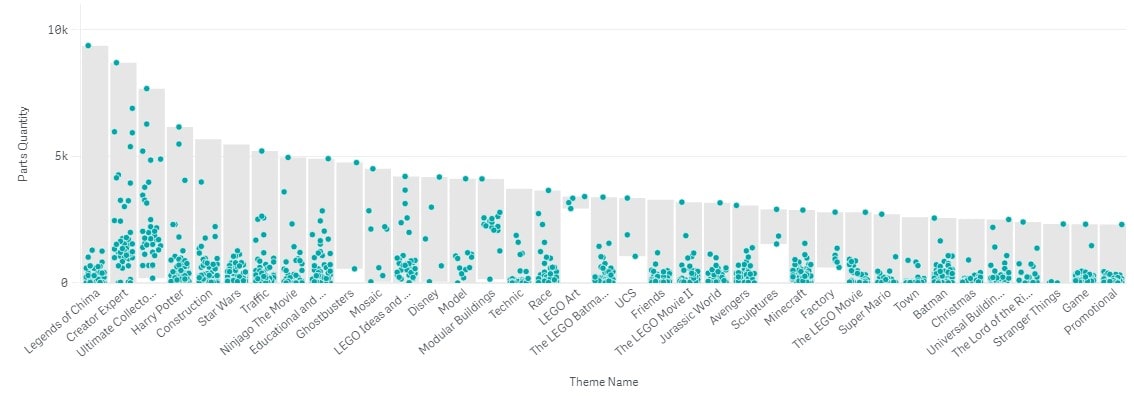
Let's take a look at the above distribution plot. This plot shows the minimum and maximum number of parts per set (length of the grey column). Each column is a Theme and the theme which contains the set with the most parts is on the far left. Each dot in these columns is a set. The higher up the set in these columns, the more parts it contains. This visual gives us a quick overview of how equal set size is distributed within a theme. Compare the first two columns for example. Legends of Chima and Creator Expert are the theme names. What do you see? You can see that Legends of Chima has the set with the most parts currently (The Ultimate Battle for Chima) and Creator Expert has the second largest set (Tower Bridge) but what the chart also tells you is that - since there are many dots between the topmost and the bottom - Creator Expert in general has sets with more parts, whereas the Legends of Chima universe has just one big set and the rest is at the very bottom.
Answering an important question
Like I mentioned before, I love LEGO and I like to share that passion with children in my family. It was fun to look at the dashboard and discover some interesting facts about LEGO sets, but I wanted to put this to a real use and help me with selecting a gift for my niece. As I loved pirate ships as a child, I decided to start with that. Looking to pick a gift, I searched for “Pirates” in the filter for Themes and here is what I have found:
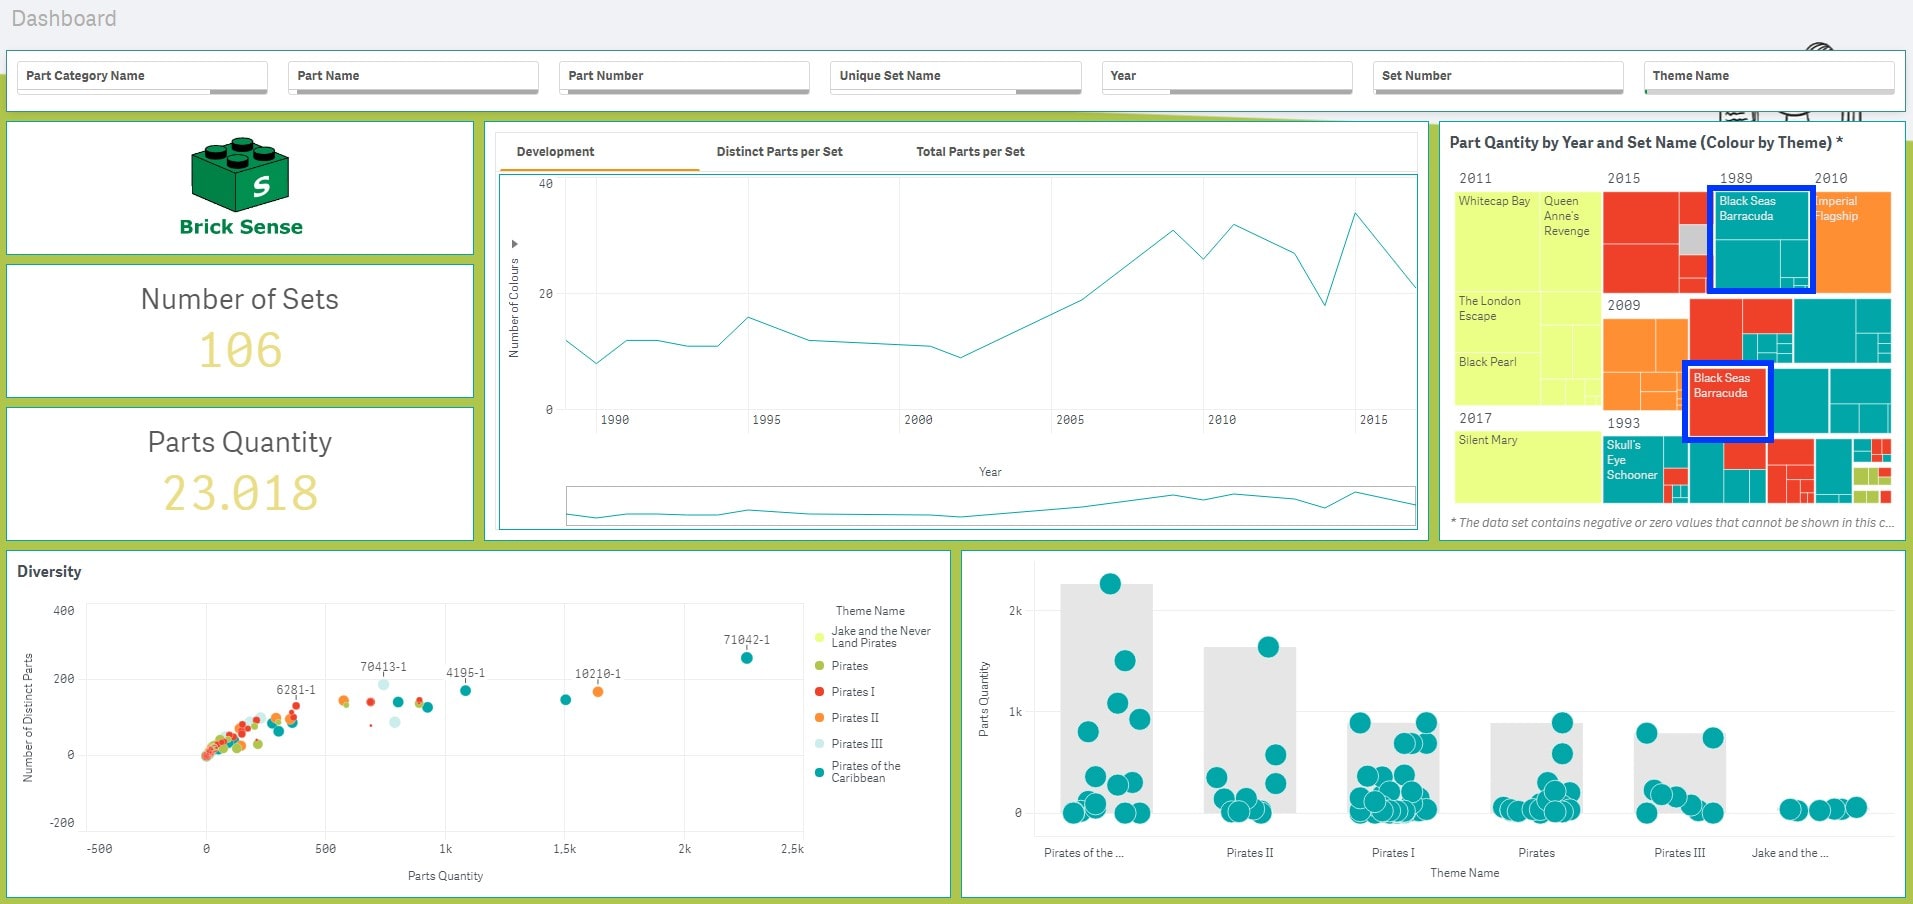
There are 106 pirate sets to choose from, but something else caught my attention. My absolute favourite set from back in the day - the Black Seas Barracuda, a pirate ship with all the things you could want, jolly roger flag, sails, masts, ropes, pirates, flintlock pistols, treasure chests, and all the adventure you could want. What I saw was that the set has been re-released in 2002, I’ve owned the original in 1989. Now that would make an interesting gift and since it is not 30 years old, it might not be too costly, but is it worth it? After selecting the two sets I found that there was a difference in parts.
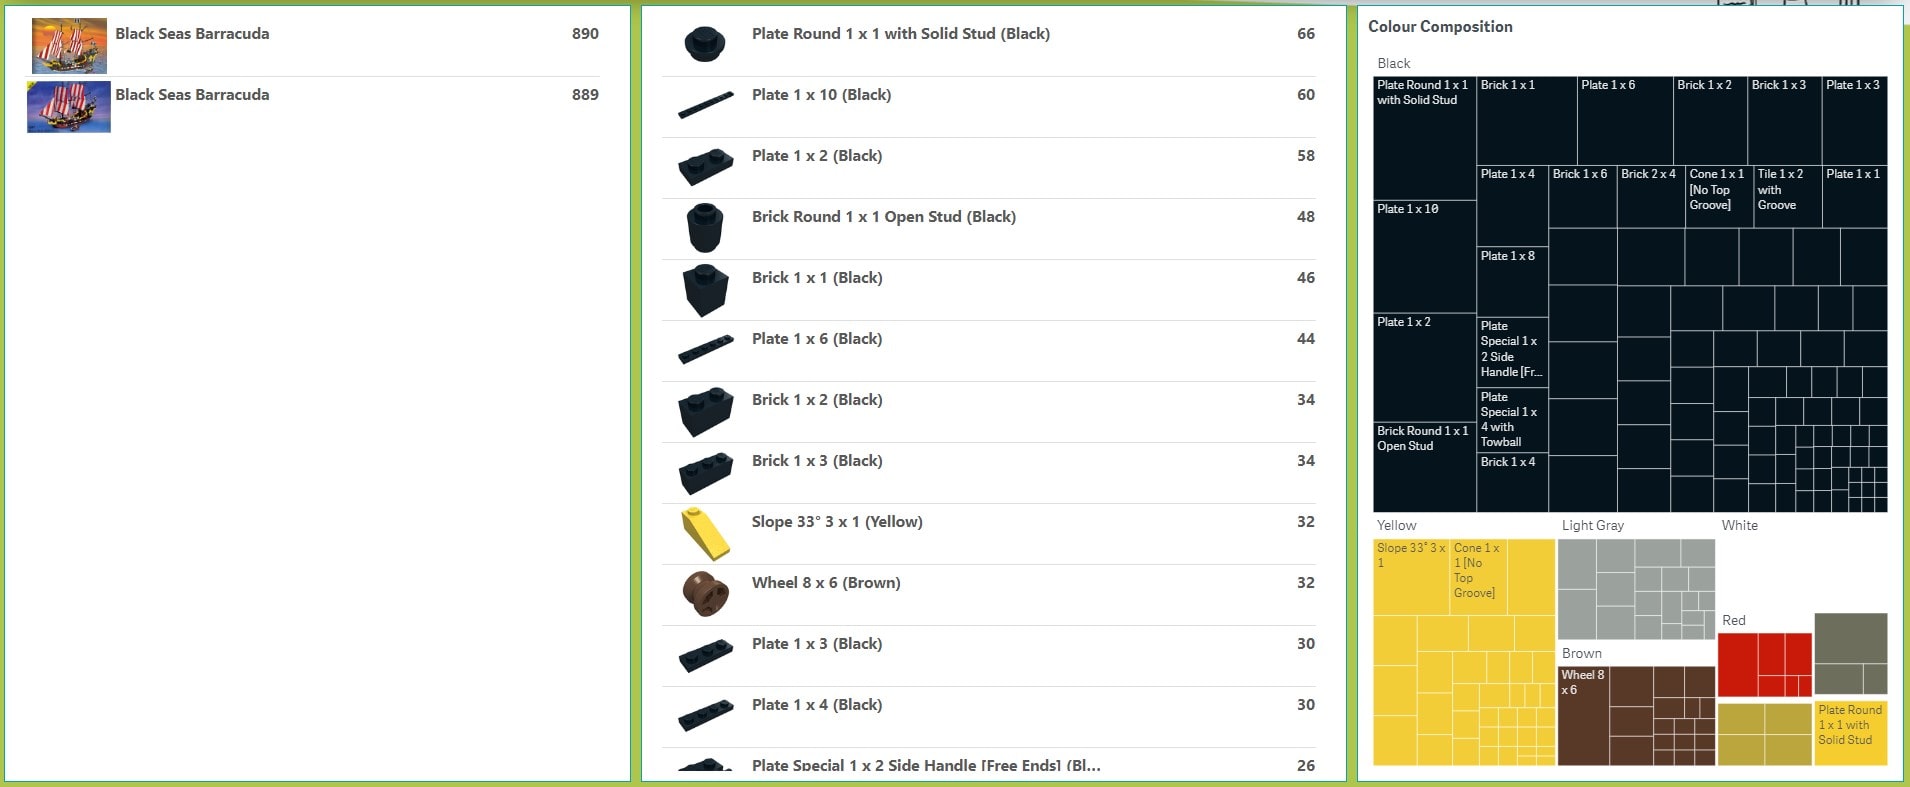
I became curious and wanted to see what was the difference between these two sets, so I created a table to compare the two sets:
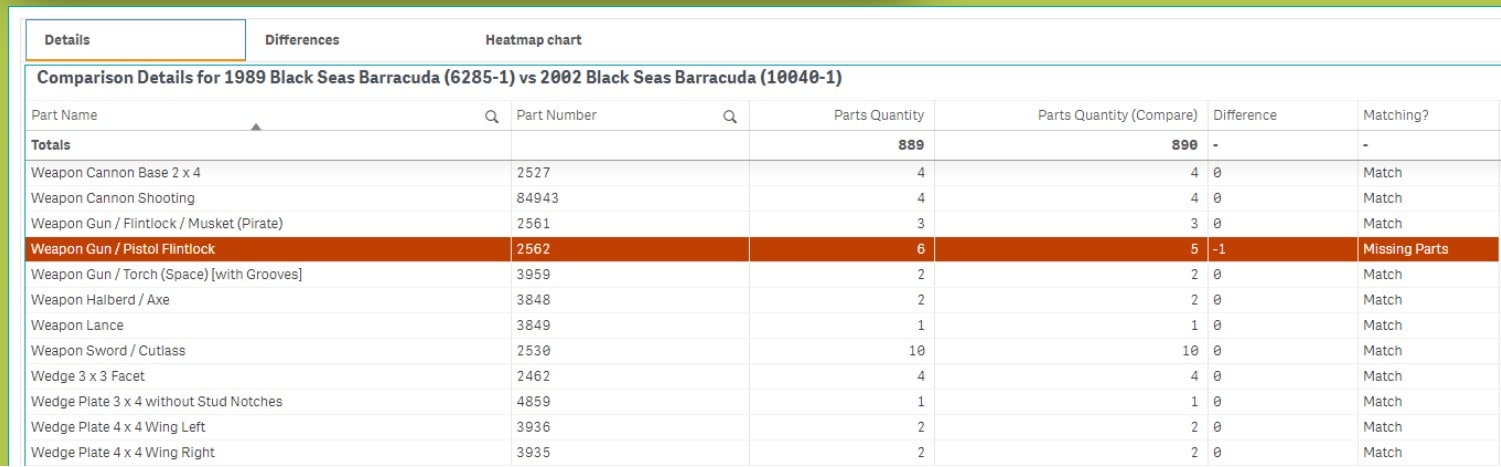
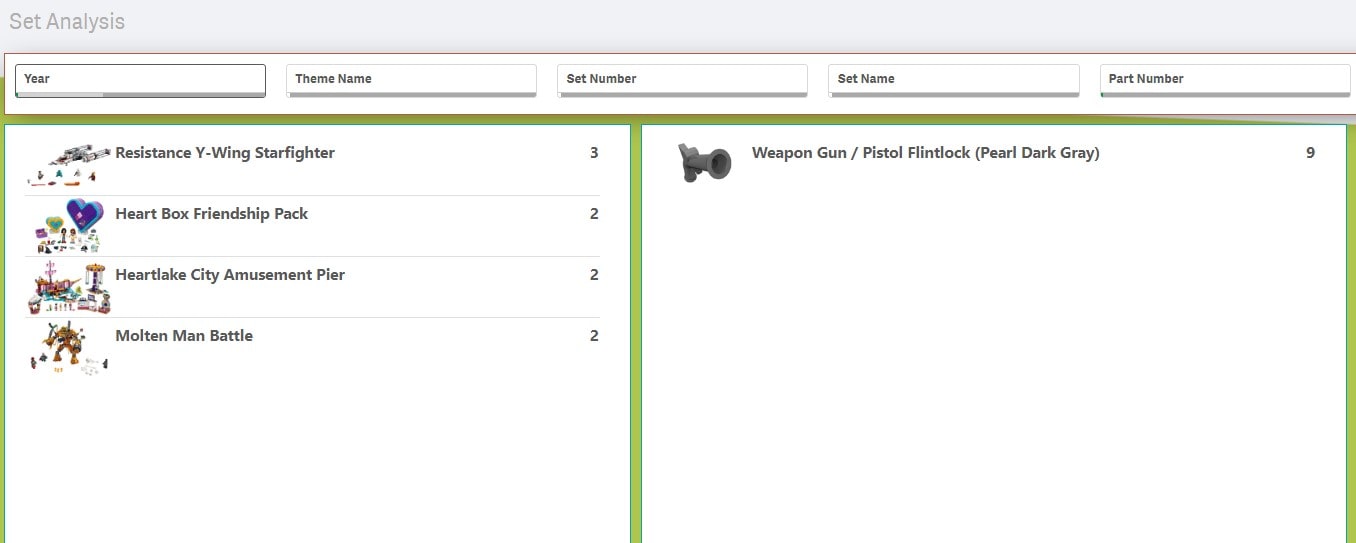
What this told me was that the main difference between the two releases there was a missing part, and the missing part was a flintlock pistol (the new model has five instead of six), which is a shame but not a deal breaker. A quick selection of the part number showed me that if I wanted this pistol, there were 106 sets available that I could get one of these pistols from (4 of them released in 2019).
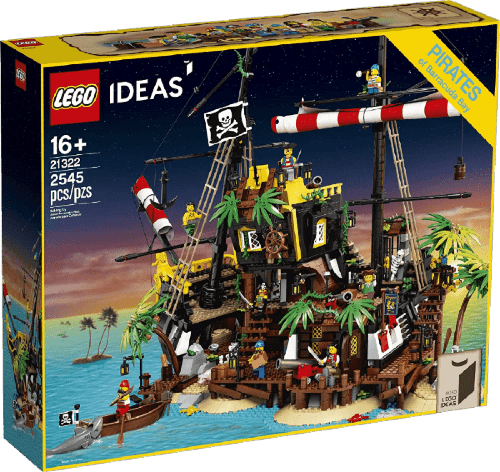
Also, while searching for “Barracuda” in Brick Sense I found an interesting new set released in 2020 called “The pirates of Barracuda Bay”. This is a pirate island containing tons of play worth, the B-model (the alternative you can build from the same bricks in the set) is a pirate ship and it’s available off the shelf today. There will be one happy kid, I’m sure.
What we discovered so far...
There have been a lot of things I wanted to share with you today:
- Playing with data is like playing with bricks. You use creative energy to form an image in your mind. Then you search for the necessary pieces to put together your model - and then you play with it.
- Playing with models (or analytics applications) is fun and important since you will find things that you haven’t thought about before.
- Using these models (or analytics applications) to answer real world questions (what can I gift for a birthday is just one of them) is even more satisfying then just playing around with them.
- Be curious and be creative.
These were just a few examples for what you can do with data analytics, can you come up with additional ideas? What would you do with this kind of data? Why not have a go with the analytics below and share your findings with us here.